How-to
Version 4, 30.01.2025
This page provides insight into the EBV netCDF data format, offering support and guidance for your upload process.
Why is netCDF the right format for EBVs?
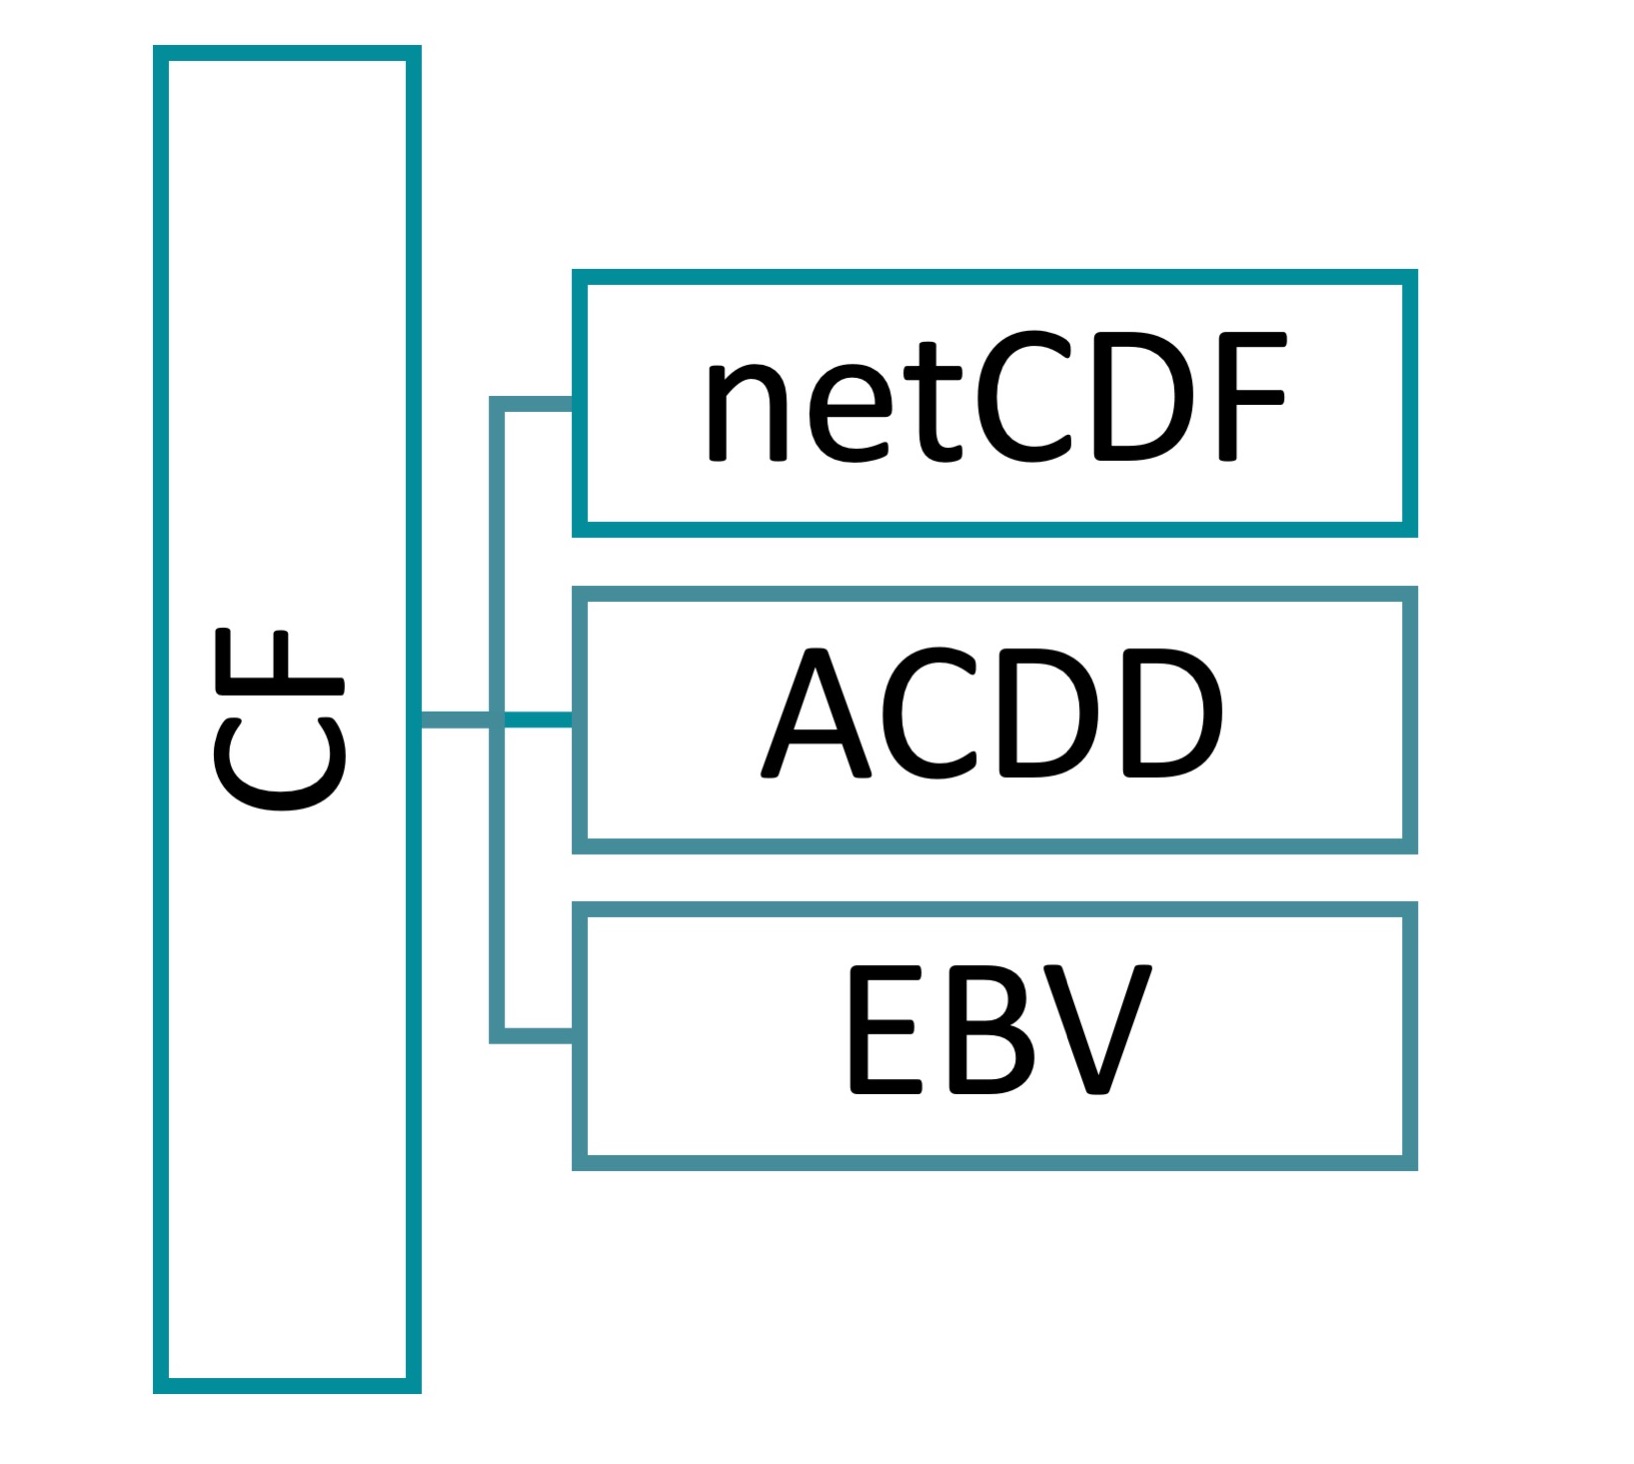
The EBV netCDF structure is designed to hold Essential Biodiversity Variables (EBV). The EBV concept is further described here. The files are based on the Network Common Data Form (netCDF). Additionally, it follows the Climate and Forecast Conventions (CF, version 1.8) and the Attribute Convention for Data Discovery (ACDD, version 1.3). The Network Common Data Form was chosen because of its ability to accommodate the hierarchical, multidimensional data format outlined in the subsequent section. Furthermore, the CF convention provides the foundation for the internal structure of the EBV netCDFs. This includes e.g., the definition of the dimensions, coordinate variables, georeferencing and more, thereby enabling to use these files with common GIS software such as GDAL and QGIS. Also, the CF convention is increasingly used in the community of Earth sciences data. This convention covers the core metadata terms. These metadata terms are enriched by the ACDD. Additional terms for the precise description of EBV specifications were added. The result is a self-describing data set holding raster data for Essential Biodiversity Variables.
© Langer / iDiv
What are the key features of the EBV netCDF files?
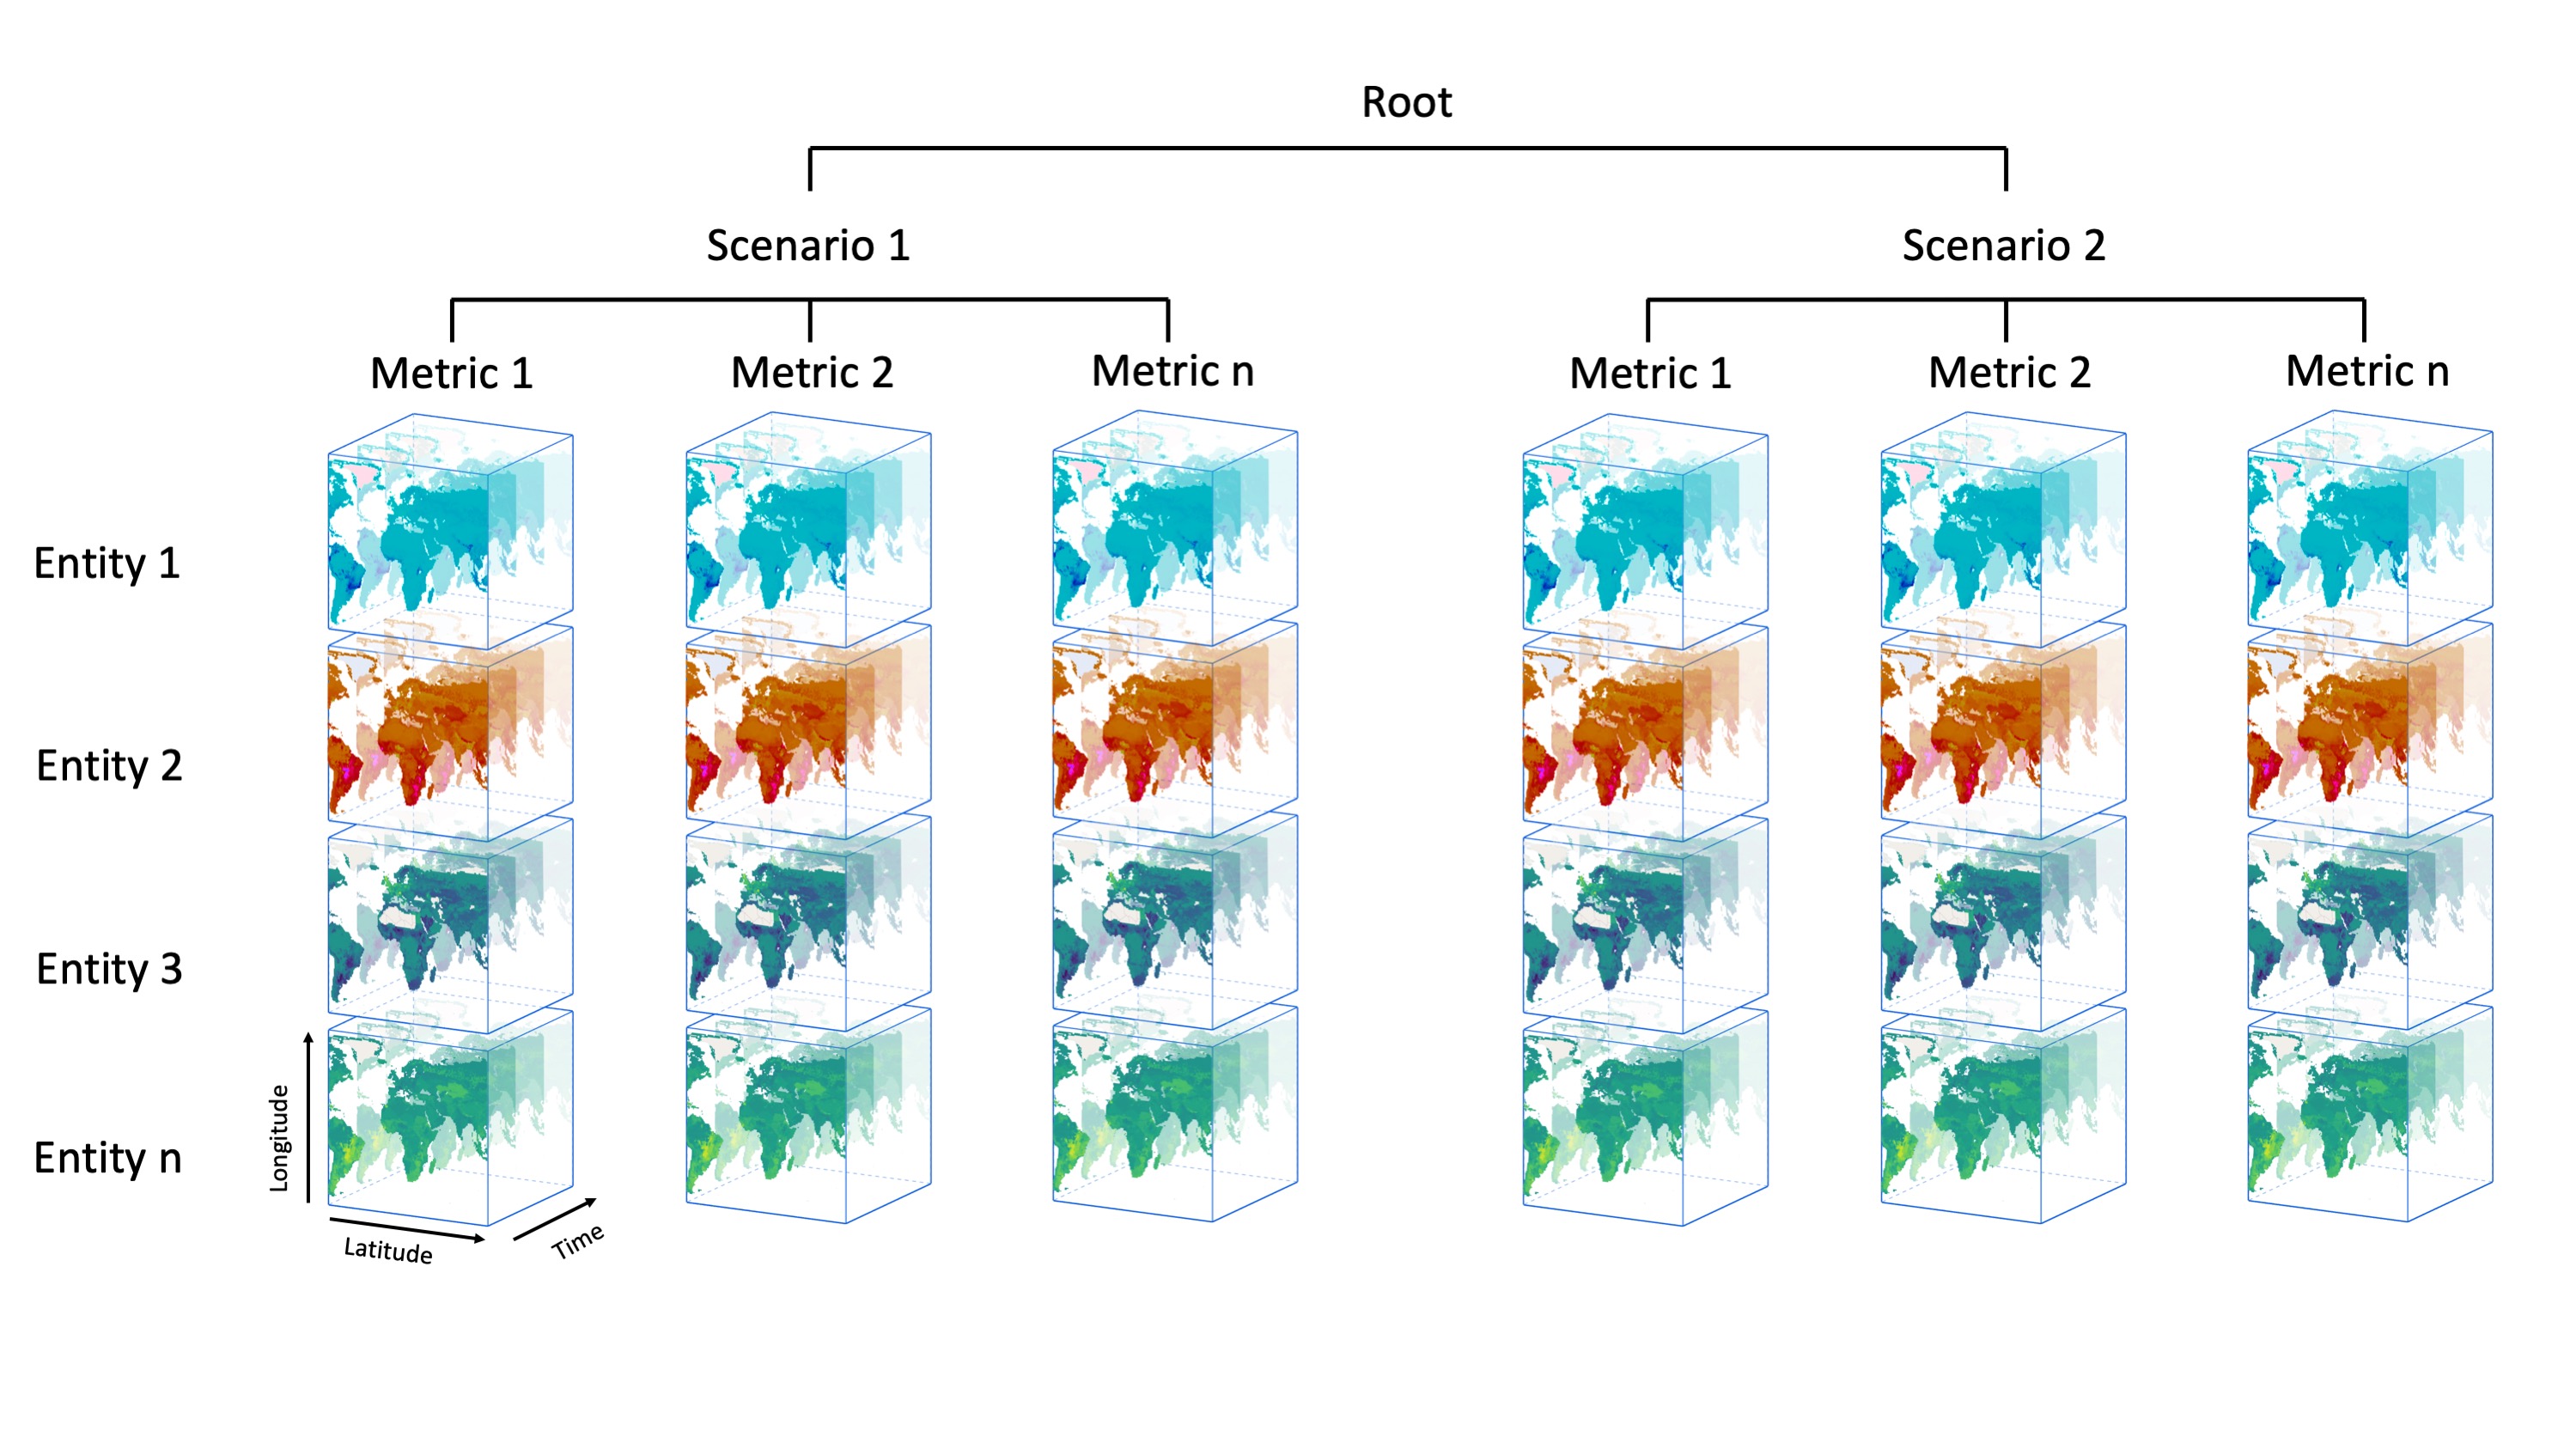
The structure allows several data cubes per netCDF file. These cubes have four dimensions: longitude, latitude, time and entity, whereby the last dimension can, e.g., encompass different species or groups of species, ecosystem types or other. Each cube holds data of a specific metric.
The usage of hierarchical groups enables the coexistence of multiple data cubes, each sharing the same dimensions. The first hierarchical level (netCDF groups) are scenarios, e.g., the modelling for different Shared Socioeconomic Pathways (SSP) scenarios. The second hierarchical level (netCDF groups) represent metrics, such as the percentage of protected area per pixel or the proportional loss over a certain time span per pixel. In contrast to the scenario-level (which is not mandatory), each EBV netCDF must have at least one metric. All metrics are repeated per scenario, if any are present. The number of scenarios and metrics included in the data sets can and will vary.
An extensive description of the EBVCube format can be found in this repository.
Just keep in mind: All EBV netCDF files always have a metric. But they may or may not have a scenario at the higher level. The resulting data cube(s) hold(s) the data per metric. These data cubes are 4D.
© Langer / iDiv
What metadata are included?
The metadata in the netCDF file is based on the information that you provide in the upload form here in the portal. The following tables bundle these terms. In the netCDF files itself there is more metadata than you can find here in this tables. There are technical terms which are added for, e.g., the noData-value description, the georeferencing and more.
As the names in the upload form differ from the ones in the netCDF, both are shown in the table. Remember: the metadata terms in the netCDF (mostly) follow a convention. That’s why the name in the upload form sometimes differs: to make it clearer for the users. The mandatory attributes are indicated by the little star.
In addition to the terms listed below, the name, email address and institution of the publisher are automatically added to the metadata. The publisher is the person who submits the data set to us for review. If you want another person to be the publisher, you can transfer the rights to another person in the "My uploads" section of the "Upload" tab before submitting the data set for review.
a. What is the General Information needed to document your data?
| Name: upload form | Name: netCDF | Description |
|---|---|---|
| Title* | title | A short phrase or sentence describing the dataset |
| Date of creation* | date_created | The date on which this version of the data was created in YYYY-MM-DD format |
| Summary* | summary | A paragraph describing the dataset, analogous to an abstract for a paper |
| References* | references | Published or web-based references that describe the data or methods used to produce it |
| Methods* | source | The method of production of the original data. If it was model-generated, source should name the model and its version. If it is observational, source should characterize it |
| Coverage Content Type* | coverage_content_type | Describes the source of the data based on an ISO 19115-1 code (image, thematicClassification, physicalMeasurement, auxiliaryInformation, qualityInformation, referenceInformation, modelResult, or coordinate) |
| Project Name* | project_name | The name of the project(s) principally responsible for originating this data. Multiple projects can be separated by commas |
| Project URL* | project_url | The URL(s) of the project(s) |
| Creator Name* | creator_name | The name of the person principally responsible for creating this data |
| Creator Email* | creator_email | The email address of the person principally responsible for creating this data |
| Creator Institution* | creator_institution | The institution of the creator; should uniquely identify the creator's institution |
| Co-creators* | contributor_name | The name of any individuals, projects, or institutions that contributed to the creation of this data |
| License* | license | Provide the URL to a standard or specific license |
b. What are the EBV attributes and how do they impact the data cube structure?
On the second page of the upload form, you are asked for specific attributes related to the EBV class and name, entity, metric, scenario, spatial scope, and temporal resolution of your dataset.
A key information is bundled in the metric and the scenario section. It is important to keep in mind, that even though, they are next to each other, inside the netCDF file these are nested hierarchical. Meaning: If you, e.g., add two scenarios and one metric, the latter will be in both scenarios which means you will have two data cubes – one for each scenariometric combination. The metrics are basically all the data sets you have for one EBV. So, if you have the absolute number of birds (count) and additionally the change over time (percentage), you have to add two metrics.
You will also need to fill in the information regarding the entity, like the entity type and scope. Remember, the entity is one of the dimensions of the data cube(s). For example, the entity type could be ‘Species’ and the scope could be ‘African great apes’. The actual entities are the seven African great apes – you need to give this information as a CSV table on the last page of the upload form. Check out some examples to understand this concept in more depth (see section four of this document).
EBV class and EBV Name:
| Name: upload form | Name: netCDF | Description |
|---|---|---|
| EBV Class* | ebv_class | EBV Class of the dataset. (The EBV Class is GEO BON's classification system for biodiversity monitoring. It categorizes and organizes essential ecological variables across scales and biological levels. This standardized framework helps identify and prioritize key variables representing biodiversity aspects like species composition, population dynamics, ecosystem functioning, and habitat quality.) |
| EBV Name* | ebv_name | EBV Name of the dataset. (The EBV Name is a unique identifier for a specific variable in the EBV Class, representing a distinct aspect of biodiversity. It helps identify and categorize measured or monitored biodiversity information. The EBV Name reflects the ecological attribute being assessed, such as "Species Richness", "Population Abundance", "Functional Diversity", "Habitat Fragmentation", or "Ecosystem Productivity”.) |
Entity attributes:
| Name: upload form | Name: netCDF | Description |
|---|---|---|
| Entity Type* | ebv_entity_type | EBV entity type, e.g., ‘Species’ |
| Entity Scope(*) | ebv_entity_scope | Specifies the entity scope in more detail, e.g.,‘African great apes’ |
| Classification System Name | ebv_entity_classification_name | Name of the classification system used for the entity types (optional) |
| Classification System Reference | ebv_entity_classification_url | URL of the classification system used for the entity types (optional) |
Metric attributes:
| Name: upload form | Name: netCDF | Description |
|---|---|---|
| Name* | standard_name | A short name of the metric |
| Description* | long_name | A longer description of the metric |
| Units* | units | The units of the variable's data values |
Scenario attributes:
| Name: upload form | Name: netCDF | Description |
|---|---|---|
| Name* | standard_name | A short name of the scenario |
| Description* | long_name | A longer description of the scenario |
Spatial scope:
| Name: upload form | Name: netCDF | Description |
|---|---|---|
| Spatial scope* | ebv_spatial_scope | Spatial scope of the data set, either ‘Continental/Regional’, ‘National’, ‘Sub-national/Local’ or ‘Global’ |
| Spatial description (*) | ebv_spatial_description | Specific information about the spatial scope |
Temporal resolution:
| Name: upload form | Name: netCDF | Description |
|---|---|---|
| Temporal resolution | time_coverage_resolution | Describes the targeted time period between each value in the data set (ISO 8601:2004 date format) |
| Temporal extent | time_coverage_start & time_coverage_end | The time span covered by the dataset |
Environmental domain:
| Name: upload form | Name: netCDF | Description |
|---|---|---|
| Environmental domain | ebv_domain | Environmental domain of the data set, one or several of ‘Terrestrial’, ‘Marine’ or ‘Freshwater’ |
| Comment | comment | Miscellaneous information about the data, not captured elsewhere |
What are entities?
We already introduced the ‘entity’ as the forth dimension of the EBVCube above. This is the technical point of view.
From the biological perspective an entity can encompass very different scopes. It can for example be a certain species, so you have entities at the species level. Also, an entity could bundle a group of species, such as, forest birds and non-forest birds. Very common is also the existence of ecosystem type based entities. Simply said: the different entities that you have data for (per metric).
In regards of the upload process, you need to upload a simple *.csv file with the names of the entities. These names get stored in the EBV netCDF and connected to the entitydimension. These names should be human-readable. That means, please don’t provide, e.g. ecosystem type codes or abbreviations, but instead the full name that is directly understandable. The csv itself should simply have one column, each row one entity, no header.
What are EBVs?
If you have ever wondered why biodiversity changes and why it matters, you're in the right place. Essential Biodiversity Variables (EBVs), provide a comprehensive framework that helps us understand and protect variety of life on Earth. EBVs can be imagined as a set of standardized and harmonized observations, specifically designed to prioritize and uncover biodiversity change. They capture the essential dimensions and organizational levels of biodiversity, allowing us to study, report, and manage these changes effectively. Just like Essential Climate Variables monitor the climate, EBVs enable us to integrate diverse data from various sources, allowing us to monitor biodiversity across different spatial scales – from your local neighborhood to our entire planet – at the national, regional, or even global level. But EBVs go beyond just data collection. By linking these measurements to meaningful indicators, we gain insights that inform policies aimed at protecting and conserving biodiversity. Join us on this journey; together, we can make a difference and ensure that biodiversity data evolves into valuable information. Through the power of EBVs, we gain meaningful insights that empower us to make informed decisions and take action to safeguard our natural heritage.
What is a good title?
When choosing a title for your EBV data set, follow these guidelines:
- Be clear and specific in conveying the focus and content of your data set.
- Strive for brevity while maintaining informative and meaningful title.
- Use descriptive keywords highlighting important elements or variables in your EBV data set.
- Ensure abbreviations are consistent throughout the title and in the extended EBV data set description.
- Tailor your title for the target audience, consider the intended users and adapt the title accordingly.
- Avoid ambiguity:
- Only include specific methods, models, metrics, or indicators if it helps disambiguation.
- Only include spatial and temporal information for context if it helps disambiguation.
- Only indicate the geographic scope if it helps disambiguation.
- If your data got published before try to connect the title to this publication.
Note that the title should serve as a teaser for your data set and not replace the full metadata. A well-crafted EBV data set title should provide enough information to captivate the user's interest and encourage further exploration of the details!
Software / Visualization
-
To visualize the EBV datasets, we recommend using our interactive map at https://portal.geobon.org/map
-
With Panoply you can view all components of the netCDF file format, including the internal hierarchy and all attributes. To import an EBV dataset directly from the EBV THREDDS Server, please proceed as follows: "File" -> "Open Remote Dataset" -> enter the URL https://portal.geobon.org/thredds/fileServer/ebv/{dataset.pathname} (e.g., https://portal.geobon.org/thredds/fileServer/ebv/1/public/martins_comcom_id1_20220208_v1.nc).
-
In QGIS, you can visualize the EBV dataset directly as an OGC Web Mapping Service (WMS). Please proceed as follows: “Add WMS/WMTS Layer...” -> “New Server Connection” -> enter the URL https://portal.geobon.org/thredds/wms/ebv/{dataset.pathname}. In addition, we have developed a QGIS plugin called EBVCubeVisualizer. This plugin allows the user to explore the full metadata and hierarchical structure of the EBV datasets.
-
To open and download the dataset as openDAP in the DAP4 format, please use this URL: https://portal.geobon.org/thredds/dap4/ebv/{dataset.pathname}.
-
You can also download and open the EBV datasets directly in your R code with the ebvcube R package.
Note: You can find the {dataset.pathname} in our REST API under the respective EBV dataset.
Training and code resources
For an introduction to Panoply and EBVCube netCDFs you can find a Galaxy hands-on training Visualize EBV cube data with Panoply netCDF viewer. For an introduction to the EBVCube data format and an overview of the basic R package functions check out the EBVCube workshop from October 2024. To get more insight into the creation of EBVCubes there is an extensive workflow for the creation of Global Biodiversity Information Facility (GBIF) occurrence data cubes including taxonomic information (Estupinan-Suarez & Quoss, 2024). The data and code for the ‘Global trends and scenarios for terrestrial biodiversity and ecosystem services from 1900 to 2050’ paper (Pereira, Martins, et al., 2024) includes several scripts for the creation and analysis of EBVCubes. These scripts show the handling of EBVCube netCDFs including several scenarios and metrics (Pereira, Quoss, et al., 2024). Last but not least, the ‘Readme’ file in the GitHub repository of the ebvcube R package covers a wide range of functions.
Why is iDiv always the publisher in the dataset citation?
The publisher in the data set citation is based on the DOI. The DOI is provided by DataCite. From the DataCite-perspective, iDiv is always the publisher. This set-up is represented by the netCDF attribute naming_authority which is defined as ‘The organization that provides the initial id for the data set. [...]’ (ACDD 1.3). The DOI publisher is different from the publisher field in the EBVCube metadata. The publisher field in the EBVCube metadata is an ACDD term and contains ‘The name of the person […] responsible for publishing the data file or product to users, with its current metadata and format.’