You are viewing the Initial Version, the most recent version of this dataset.
1 version(s) available
Date of publication: June 10, 2022
Version 1
Date of publication: June 10, 2022
Type of change:
Description:
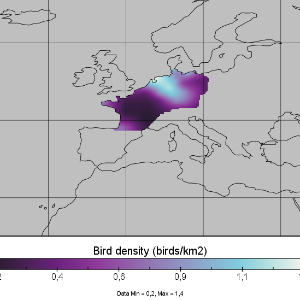
Nocturnal bird migration across western Europe
by Raphaël NussbaumerContinuous, high resolution spatio-temporal maps of nocturnal bird migration densities, flight speed in east(+)/west(-) direction (u component) and flight speed in north(+)/south(-) direction (v component) across western Europe were interpolated from vertical profile time series datasets measured by 37 weather radars in France, Germany, The Netherlands and Belgium operating between 13 February 2018 and 1 January 2019. Each raster represents a nig ...(continue reading)
DOI 10.25829/tder31Citation
Nussbaumer, R., Bauer, S., Benoit, L., Mariethoz, G., Liechti, F., Schmid, B. (2022). Nocturnal bird migration across western Europe (Version 1) [Dataset]. German Centre for Integrative Biodiversity Research. https://doi.org/10.25829/tder31nocturnal birdsmigration densityEurope
| Entities |
|---|
| Nocturnal birds |
The EBV Data Portal is supported by