You are viewing the Initial Version, the most recent version of this dataset.
1 version(s) available
Date of publication: February 28, 2024
Version 1
Date of publication: February 28, 2024
Type of change:
Description:
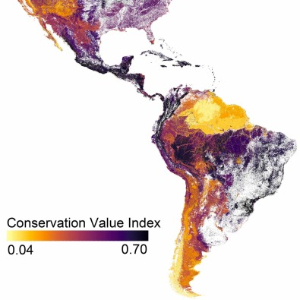
Americas species richness by macrogroup
by Lea SchulteThis dataset focuses on the Americas. Specifically, Southern Canada to South America. Maps show species richness per macrogroup in the Americas, utilizing terrestrial ecosystem data on macrogroup level and Area of Habitat (AOH) data for mammals and birds. Four maps available with values per macrogroup: (1) total species (2) threatened species (3) macrogroup-associated species (4) Conservation Priorization Index ...(continue reading)
DOI 10.25829/ja2s47Citation
Schulte, L., Valdez, J., Luise, Q. (2024). Americas species richness by macrogroup (Version 1) [Dataset]. German Center for Integrative Biodiversity Research. https://doi.org/10.25829/ja2s47HabitatsSouth AmericaNorth AmericaCentral AmericaHabitat assessment
| Entities |
|---|
| Eastern Pacific Mangrove |
| Western Atlantic & Caribbean Mangrove |
| Longleaf Pine Woodland |
| Southern Mesic Mixed Broadleaf Forest |
| Californian Forest & Woodland |
| Madrean Lowland Evergreen Woodland |
| Madrean Montane Forest & Woodland |
| Central Midwest Oak Forest, Woodland & Savanna |
| Laurentian-Acadian Mesic Hardwood - Conifer Forest |
| Balconian Forest & Woodland |
| Southern & South-Central Oak - Pine Forest & Woodland |
| Rocky Mountain Subalpine-High Montane Forest |
| Sierra Madre High Montane Forest |
| Southern Rocky Mountain Lower Montane Forest |
| Southern Vancouverian Montane-Foothill Forest |
| Vancouverian Coastal Rainforest |
| Vancouverian Subalpine-High Montane Forest |
| Intermountain Singleleaf Pinyon - Juniper Woodland |
| Southern Rocky Mountain-Colorado Plateau Two-needle Pinyon - Juniper Woodland |
| Great Plains Flooded & Swamp Forest |
| Central Hardwood Floodplain Forest |
| Southern Coastal Plain Floodplain Forest |
| Southern Coastal Plain Evergreen Hardwood - Conifer Swamp |
| Southern Coastal Plain Basin Swamp & Flatwoods |
| Rocky Mountain-Great Basin Montane Riparian & Swamp Forest |
| Vancouverian Flooded & Swamp Forest |
| Interior Warm & Cool Desert Riparian Forest |
| Californian Chaparral |
| Californian Coastal Scrub |
| Californian Annual & Perennial Grassland |
| Central Rocky Mountain Montane-Foothill Grassland & Shrubland |
| Southern Rocky Mountain Montane Shrubland |
| Southern Vancouverian Lowland Grassland & Shrubland |
| Great Plains Mixedgrass & Fescue Prairie |
| Great Plains Sand Grassland & Shrubland |
| Western Great Plains Shortgrass Prairie |
| Central Lowlands Tallgrass Prairie |
| Eastern North American Coastal Dune & Grassland |
| Pacific Coastal Cliff & Bluff |
| Pacific Coastal Beach & Dune |
| Eastern North American Coastal Beach & Rocky Shore |
| Eastern North American Cool Temperate Seep |
| North Pacific Bog & Fen |
| Southeastern Coastal Bog & Fen |
| Atlantic & Gulf Coastal Fresh-Oligohaline Tidal Marsh |
| Atlantic & Gulf Coastal Plain Wet Prairie & Marsh |
| Eastern North American Marsh, Wet Meadow & Shrubland |
| Great Plains Marsh, Wet Meadow, Shrubland & Playa |
| Vancouverian Lowland Marsh, Wet Meadow & Shrubland |
| Western North American Vernal Pool |
| North American Boreal Marsh, Wet Meadow & Shrubland |
| Warm Desert Lowland Freshwater Marsh, Wet Meadow & Shrubland |
| Great Plains Saline Wet Meadow & Marsh |
| North American Atlantic & Gulf Coastal Salt Marsh |
| North American Pacific Coastal Salt Marsh |
| Warm & Cool Desert Alkali-Saline Marsh, Playa & Shrubland |
| Chihuahuan Desert Scrub |
| Chihuahuan Semi-Desert Grassland |
| Mojave-Sonoran Semi-Desert Scrub |
| Viscaino-Baja California Desert Scrub |
| Warm Interior Chaparral |
| North American Warm-Desert Xeric-Riparian Scrub |
| Great Basin Saltbush Scrub |
| Cool Interior Chaparral |
| Great Basin-Intermountain Xeric-Riparian Scrub |
| Rocky Mountain-Sierran Alpine Tundra |
| Vancouverian Alpine Tundra |
| Temperate Pacific Seaweed Intertidal Vegetation |
| Western North American Freshwater Aquatic Vegetation |
| Eastern North American Cliff & Rock Vegetation |
| Great Plains Badlands Vegetation |
| Great Plains Cliff, Scree & Rock Vegetation |
| North American Warm Semi-Desert Cliff, Scree & Rock Vegetation |
| Intermountain Basins Cliff, Scree & Badland Sparse Vegetation |
| Tamaulipan Scrub & Grassland |
| Eastern North American Alpine Tundra |
| Caribbean Coastal Lowland Dry Forest |
| Chaco Xeromorphic Cliff & Other Rock Vegetation |
| Great Plains Forest & Woodland |
| Southern Great Plains Floodplain Forest & Woodland |
| Great Plains Comanchian Scrub & Open Vegetation |
| Laurentian-Acadian Pine - Hardwood Forest & Woodland |
| Pond-cypress Basin Swamp |
| Florida Peninsula Scrub & Herb |
| Rocky Mountain-Vancouverian Subalpine-High Montane Mesic Meadow |
| Great Basin-Intermountain Tall Sagebrush Steppe & Shrubland |
| Great Basin-Intermountain Dwarf Sagebrush Steppe & Shrubland |
| Great Basin-Intermountain Dry Shrubland & Grassland |
| Temperate Pacific Seagrass Intertidal Vegetation |
| Caribbean Lowland Humid Forest |
| Neotropical Floating & Submerged Freshwater Marsh |
| Caribbean Dry Limestone Forest |
| Caribbean-Mesoamerican Pine Dry Forest |
| North American Boreal Conifer Poor Swamp |
| Southern Barrens & Glade |
| Southeastern Coastal Plain Patch Prairie |
| Western Amazon Savanna |
| Central Amazon Savanna |
| Northern Andean Montane & Upper Montane Grassland & Shrubland |
| Bolivian-Tucuman Montane Grassland & Shrubland |
| Moist Puna Grassland & Scrub |
| Semi-Arid Pampa Grassland & Shrubland |
| Eastern North American Boreal Forest |
| West-Central North American Boreal Forest & Woodland |
| Central Rocky Mountain Mesic Lower Montane Forest |
| Central Rocky Mountain Dry Lower Montane-Foothill Forest |
| Appalachian-Northeastern Oak - Hardwood - Pine Forest & Woodland |
| Central Hardwood Swamp Forest |
| Laurentian-Acadian-North Atlantic Coastal Flooded & Swamp Forest |
| Laurentian-Acadian Acidic Rocky Scrub & Grassland |
| Appalachian Rocky Felsic & Mafic Scrub & Grassland |
| Laurentian-Acadian Calcareous Scrub & Grassland |
| Central Interior Calcareous Scrub & Grassland |
| Central Interior Acidic Scrub & Grassland |
| North American Warm Desert Ruderal Scrub & Grassland |
| Caribbean-Mesoamerican Seasonal Dry Forest |
| Pacific Mesoamerican Seasonal Dry Forest |
| Guajiran Seasonal Dry Forest |
| Llanos Seasonal Dry Forest |
| Tumbes Guayaquil Seasonal Dry Forest |
| Central Guianan Seasonal Dry Forest |
| Brazilian Atlantic Seasonal Dry Forest |
| Cerrado Seasonal Dry Forest |
| Parana Seasonal Dry Forest |
| Caatinga Seasonal Dry Forest |
| Northern Andean Seasonal Dry Forest |
| Central Andean Seasonal Dry Forest |
| Bolivian-Tucuman Seasonal Dry Forest |
| Mesoamerican Lowland Humid Forest |
| Guajiran Humid Forest |
| Catatumbo Magdalena Humid Forest |
| Choco-Darien Humid Forest |
| Western Ecuadorian Humid Forest |
| Llanos Humid Forest |
| Western Guianan Humid Forest |
| Central Guianan Humid Forest |
| Eastern Guianan Humid Forest |
| Orinoquian Humid Forest |
| Western Amazon Lowland Humid Forest |
| Western Amazon Subandean Humid Forest |
| Southwestern Amazon Lowland Humid Forest |
| Southwestern Amazon Subandean Humid Forest |
| Northern Amazon Humid Forest |
| Central Amazon Humid Forest |
| Brazilian Atlantic Humid Forest |
| Parana Humid Forest |
| Cerrado Humid Forest |
| Caribbean Montane Humid Forest |
| Mesoamerican Montane Humid Forest |
| Mesoamerican Montane Pine-Oak Forest |
| Southern Mesoamerican Montane Humid Forest |
| Central Guianan Montane Humid Forest |
| Eastern Guianan Montane Humid Forest |
| Northern Andean Montane & Upper Montane Humid Forest |
| Northern Andean Lower Montane Humid Forest |
| Northern Andean Venezuelan Coastal Ridge Forest |
| Central Andean (Yungas) Montane & Upper Montane Humid Forest |
| Central Andean (Yungas) Lower Montane Humid Forest |
| Bolivian-Tucuman Montane & Upper Montane Humid Forest |
| Bolivian-Tucuman Lower Montane Humid Forest |
| Moist Puna Humid Forest |
| Eastern Subandean Ridge Montane Humid Forest |
| Brazilian Atlantic Montane Humid Forest |
| Caribbean Swamp Forest |
| Caribbean Floodplain Forest |
| Mesoamerican Coastal Plain Swamp Forest |
| Mesoamerican Floodplain Forest |
| Guajiran Flooded Forest |
| Choco-Darien Floodplain Forest |
| Llanos Flooded & Swamp Forest |
| Guayaquil Flooded & Swamp Forest |
| Guianan Riparian Forest |
| Guianan Swamp Forest |
| Orinoco Delta Swamp Forest |
| Northern Andean Riparian Forest |
| Central Andean Riparian Forest |
| Bolivian-Tucuman Dry Valley Riparian Forest |
| Eastern Subandean Ridge Flooded Forest |
| Western Amazon Floodplain Forest |
| Western Amazon Swamp Forest |
| Southwestern Amazon Floodplain Forest |
| Southern Amazon Swamp Forest |
| Northern Amazon Floodplain Forest |
| Central Amazon Floodplain Forest |
| South-Central Amazon Floodplain Forest |
| Amazon Delta Swamp Forest |
| Brazilian Atlantic Coastal Plain Swamp Forest |
| Parana Floodplain Forest |
| Cerrado Floodplain Forest |
| Beni Chiquitano Swamp Forest |
| Beni Floodplain Forest |
| Pantanal Floodplain Forest |
| Northern Chaco Floodplain Forest & Woodland |
| Northern Chaco Riparian Scrub & Woodland |
| Northern Chaco Palm Swamp |
| Southern Chaco Floodplain Forest & Woodland |
| Chilean Mediterranean Sclerophyllous Forest |
| Chilean Mediterranean Deciduous Forest |
| Espinal Deciduous Forest & Woodland |
| Valdivian Lower Montane Evergreen Forest |
| Valdivian Lower Montane Deciduous Forest |
| Valdivian Montane & Upper Montane Deciduous Forest |
| Valdivian Montane & Upper Montane Evergreen Forest |
| Magellanian Temperate Evergreen Forest |
| Mexican Interior Riparian Forest |
| Espinal Floodplain Forest |
| Chilean Mediterranean & Desert Riparian & Flooded Forest |
| Valdivian Temperate Flooded & Swamp Forest |
| Monte Floodplain Forest |
| Caribbean Dry Scrub |
| Northern Mesoamerican Pine Savanna |
| Northern Mesoamerican Savanna & Shrubland |
| Llanos Upland Savanna |
| Central Guianan Savanna & Shrubland |
| Western Guianan Savanna& Shrubland |
| Eastern Guianan Savanna & Shrubland |
| Brazilian Atlantic Coastal Plain Savanna & Woodland |
| Cerrado Savanna |
| Parana Upland Savanna & Shrubland |
| Mesoamerican Montane Grassland & Shrubland |
| Tepuyan Sclerophyllous Shrubland |
| Tepuyan Mesic Grass & Forb Meadow |
| Northern Andean Paramo |
| Central Andean (Yungas) Upper Montane Grassland & Shrubland |
| Brazilian-Parana Montane Grassland, Savanna & Forb Meadow |
| Caribbean-Mesoamerican Coastal Dune & Beach |
| Eastern Guianan Coastal Rocky Shore & Beach |
| Brazilian Atlantic Coastal Beach & Dune |
| Tropical Eastern Pacific Coastal Beach & Dune |
| Tepuyan Bog |
| Orinoquian Floodplain Peat Meadow & Marsh |
| Tropical Andes Upper Montane Bog |
| Amazon Delta Peat Marsh |
| Caribbean Freshwater Marsh, Wet Meadow & Shrubland |
| Mesoamerican Freshwater Marsh, Wet Meadow & Shrubland |
| Llanos Flooded Savanna |
| Central Guianan Flooded Savanna |
| Western Guianan Flooded Savanna & Shrubland |
| Orinoquian Floodplain Marsh & Flooded Savanna |
| Northern Andean Wet Meadow |
| Andean Puna Wet Meadow |
| Amazonian-Guianan White Sand Flooded Savanna & Shrubland |
| Upper Amazon Wet Meadow & Shrubland |
| Lower Amazon Wet Meadow & Shrubland |
| Cerrado Flooded Savanna |
| Beni Flooded Savanna |
| Pantanal Floodplain Wet Meadow & Shrubland |
| Parana Floodplain Wet Meadow & Shrubland |
| Chaco Riparian Marsh & Shrubland |
| Eastern Chaco Marsh & Flooded Savanna |
| Tropical Western Atlantic-Caribbean Salt Marsh |
| Mexican Pacific Coastal Salt Marsh |
| Mesoamerican-South American Pacific Coastal Salt Marsh |
| Chaco-Espinal Brackish Marsh |
| Central Andean Altiplano Salt Flats |
| South American Pacific Desert Salt Flats |
| Central Chilean Coastal Scrub |
| Central Chilean Interior Scrub |
| Southern Andean Mediterranean Montane Scrub & Forb Meadow |
| Chaco Serrano Scrub & Grassland |
| Monte Scrub & Grassland |
| Humid Pampa Grassland & Shrubland |
| Patagonian Dry Grassland & Shrubland |
| Patagonian Mesic Grassland & Shrubland |
| Atlantic Coast & La Plata Delta Beach & Dune |
| Patagonian Coastal Grassland & Shrubland |
| Southern Andean Montane Bog |
| Magellanian Anti-Boreal Bog & Fen |
| Pampean Freshwater Marsh, Wet Meadow & Shrubland |
| Southern Andean Montane Salt Marsh |
| South American Temperate Interior Brackish Marsh |
| Temperate & Austral Atlantic Coastal Salt Marsh |
| Caribbean-Northern Mesoamerican Xeromorphic Scrub & Woodland |
| Guajiran Xeromorphic Scrub & Woodland |
| Tumbesian Xeromorphic Scrub & Woodland |
| Northern Andean Xeromorphic Scrub & Woodland |
| Central Andean Xeromorphic Scrub & Woodland |
| Bolivian-Tucuman Xeromorphic Scrub & Woodland |
| Northwestern Chaco Xeromorphic Scrub & Woodland |
| Northeastern Chaco Xeromorphic Scrub & Woodland |
| Southern Chaco Xeromorphic Scrub & Woodland |
| Northern Interandean Xeromorphic Scrub & Grassland |
| Central Interandean Xeromorphic Scrub & Grassland |
| Bolivian-Tucuman Interandean Xeromorphic Scrub & Grassland |
| Caatinga Xeromorphic Scrub |
| Caatinga Dense Scrub & Forb Meadow |
| Northern Chaco Xeromorphic Scrub & Savanna |
| Southern Chaco Xeromorphic Scrub & Savanna |
| Sechura Atacama Semi-Desert Riparian Scrub |
| Sechura Atacama Semi-Desert Scrub |
| Chilean Mediterranean Coastal Semi-Desert Scrub & Grassland |
| Chilean Mediterranean Interior Semi-Desert Scrub & Grassland |
| Xeric Puna Succulent Scrub |
| Mediterranean Andean Cool Semi-Desert Scrub & Grassland |
| Monte Cool Semi-Desert Scrub & Grassland |
| Patagonian Semi-Desert Scrub |
| High Northern Andean Super-Paramo |
| High Andean Moist Puna Bunch Grassland |
| High Andean Xeric Puna Bunch Grassland |
| Southern Andean Alpine Tundra |
| Magellanian Montane Tundra |
| Tepuyan Cliff, Scree & Rock Vegetation |
| Northern Andean Cliff, Scree & Rock Vegetation |
| Bolivian-Tucuman Cliff, Scree & Rock Vegetation |
| Moist Puna Cliff, Scree & Rock Vegetation |
| Sechura Atacama Semi-Desert Cliff & Pavement |
| Andean Cool Semi-Desert Rock Vegetation |
| Tropical Andean Pondshore & Wet Meadow |
| Temperate South American Freshwater Aquatic Vegetation |
| Brazilian-Parana Cliff, Scree & Rock Vegetation |
| Cerradao Sclerophyllous Woodland |
| Mesoamerican Submontane Humid Forest |
| North American Boreal & Subboreal Bog & Acidic Fen |
| North American Boreal & Subboreal Alkaline Fen |
| Eastern North American Riverscour Vegetation |
| Central Midwest Mesic Forest |
| Appalachian-Interior-Northeastern Mesic Forest |
| Southeastern Coastal Plain Evergreen Oak - Mixed Hardwood Forest |
| Southern Vancouverian Dry Foothill Forest & Woodland |
| Western North American Cliff, Scree & Rock Vegetation |
| Arid West Interior Freshwater Marsh |
The EBV Data Portal is supported by