You are viewing the Initial Version, the most recent version of this dataset.
1 version(s) available
Date of publication: May 30, 2024
Version 1
Date of publication: May 30, 2024
Type of change:
Description:
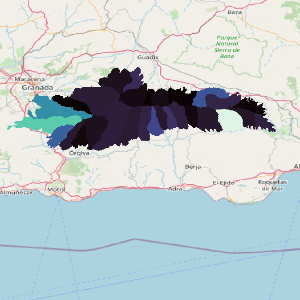
Crop production for the Sierra Nevada National Park
by Ricardo Moreno-LlorcaCrop production resulted as the most relevant ecosystem services for Sierra Nevada after conducting a focus-group with local managers. Taking this into account, we quantified the amount of different crop types in Sierra Nevada based on land use and land cover maps. Then we analysed the average crop yield from official statistics for five reference years over a 10-year period for all types of crops, both on irrigated and dry land. The calculation ...(continue reading)
DOI 10.25829/9aca95Citation
Moreno-Llorca, R. (2024). Crop production for the Sierra Nevada National Park (Version 1) [Dataset]. German Centre for Integrative Biodiversity Research. https://doi.org/10.25829/9aca95Crop productionSierra Nevada National Park
| Entities |
|---|
| Crops |
The EBV Data Portal is supported by