You are viewing the Initial Version, the most recent version of this dataset.
1 version(s) available
Date of publication: May 30, 2024
Version 1
Date of publication: May 30, 2024
Type of change:
Description:
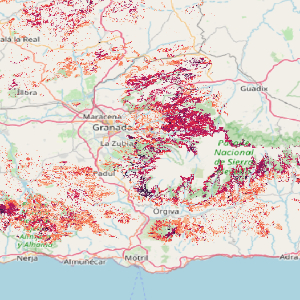
Pasture production model
by Carlos Javier Navarro
This pasture production model provides a map of Available Metabolic Energy (EMD) for a region in Andalusia. The model is based on the doctoral thesis of Passera Sassi from 1999, where equations were calibrated using field measurements.
The objective of this work was to spatially model pasture production using available spatial information layers for the region, while also identifying limitations and ways to enhance these models. This was ...(continue reading)
Citation
Navarro, C., Alcaraz-Segura, D., Martínez-López, J. (2024). Pasture production model (Version 1) [Dataset]. German Centre for Integrative Biodiversity Research. https://doi.org/10.25829/82ef2epasture productionAvailable Metabolic EnergyAndalusia
| Entities |
|---|
| Pastures |
The EBV Data Portal is supported by