You are viewing Version 2, the most recent version of this dataset.
2 version(s) available
Date of publication: November 21, 2022
Version 2
Date of publication: November 21, 2022
Type of change: Metadata
Description: Updated metadata for several fields. Hackaton 21.11.2022.
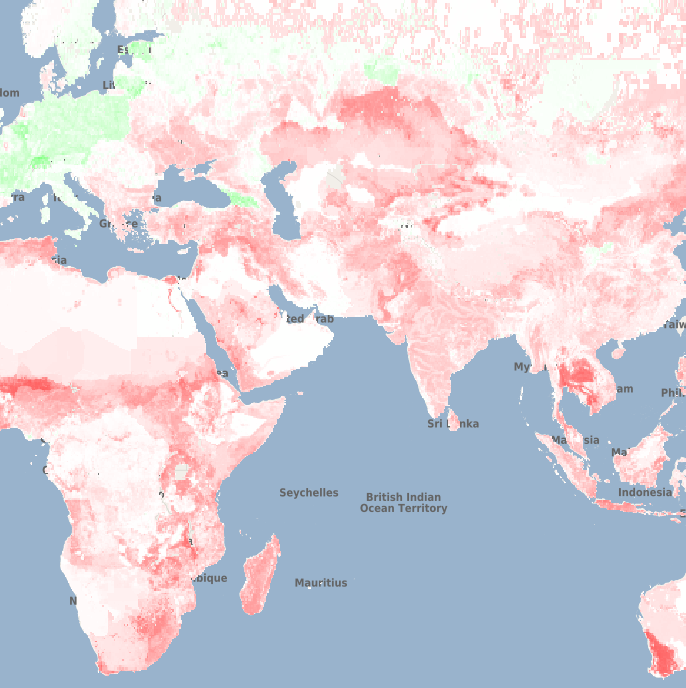
Local terrestrial diversity (PREDICTS)
by Andy PurvisChanges in average local terrestrial diversity for each one degree grid cell caused by land-use from 1900 to 2050, as estimated by the PREDICTS model based on historical reconstructions and SSP/RCP scenarios. It reports the number of species in each cell relative to a pristine baseline and the number of species in each cell relative to 1900. Produced for the BES-SIM project. ...(continue reading)
DOI 10.25829/5yq9t7Citation
Purvis, A., Hill, S. (2022). Local terrestrial diversity (PREDICTS) (Version 2) [Dataset]. German Centre for Integrative Biodiversity Research. https://doi.org/10.25829/5yq9t7PREDICTS
| Entities |
|---|
| Animal, plant and fungal species |
The EBV Data Portal is supported by