You are viewing the Initial Version, the most recent version of this dataset.
1 version(s) available
Date of publication: April 20, 2023
Version 1
Date of publication: April 20, 2023
Type of change:
Description:
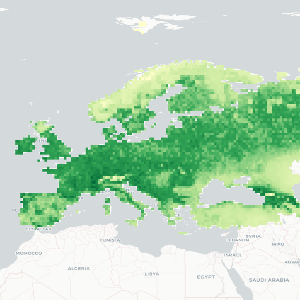
Net Primary Productivity in Europe 2015
by Elnaz NeinavazNet primary productivity (NPP) refers to a complex set of processes in which plants produce biomass by converting solar energy, carbon dioxide, and water (Roy et al., 2001). The primary productivity of vegetation acts as an entry point for atmospheric carbon into the terrestrial ecosystem. NPP is an effective indicator for monitoring forest health and stand age (He et al., 2012). NPP is an essential indicator of resource utilization, ecosystem he ...(continue reading)
DOI 10.25829/2wgs36Citation
Neinavaz, E., Martinez, M. (2023). Net Primary Productivity in Europe 2015 (Version 1) [Dataset]. German Centre for Integrative Biodiversity Research. https://doi.org/10.25829/2wgs36NPPe-shape
| Entities |
|---|
| Forest |
The EBV Data Portal is supported by