You are viewing the Initial Version, the most recent version of this dataset.
1 version(s) available
Date of publication: February 13, 2023

Version 1

Date of publication: February 13, 2023

Type of change:

Description:
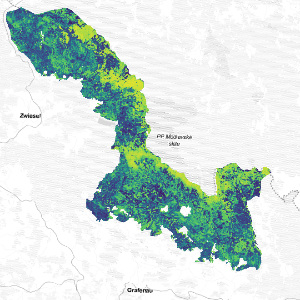
preview image

Net Primary Productivity for Bavarian Forest National Park

by Elnaz Neinavaz

Net primary productivity (NPP) refers to a complex set of processes in which plants produce biomass by converting solar energy, carbon dioxide, and water (Roy et al., 2001). The primary productivity of vegetation acts as an entry point of atmospheric carbon into the terrestrial ecosystem. NPP is an effective indicator for monitoring forest health and stand age (He et al., 2012). NPP is an essential indicator of resource utilization, ecosystem hea ...(continue reading)

DOI 10.25829/wag849
Citation
Neinavaz, E. (2023). Net Primary Productivity for Bavarian Forest National Park (Version 1) [Dataset]. German Centre for Integrative Biodiversity Research. https://doi.org/10.25829/wag849

e-shapeRemote Sensing-EBVsBavarian Forest National ParkNet Primary ProductivityNPP

58
The title of the dataset. Net Primary Productivity for Bavarian Forest National Park
The date on which this version of the data was created in YYYY-MM-DD format.
A paragraph describing the dataset.
Hover to see a suggestion for a good description. Allowed:
Net primary productivity (NPP) refers to a complex set of processes in which plants produce biomass by converting solar energy, carbon dioxide, and water (Roy et al., 2001). The primary productivity of vegetation acts as an entry point of atmospheric carbon into the terrestrial ecosystem. NPP is an effective indicator for monitoring forest health and stand age (He et al., 2012). NPP is an essential indicator of resource utilization, ecosystem health, and biosphere carbon fluxes (Cao et al., 2004). NPP can also be used as an indicator to investigate the impact of an extreme climatic event like drought on the ecosystem (Lai et al., 2018; Nanzad et al., 2021). Net Primary Productivity is also considered a remote sensing biodiversity product by the remote sensing and ecology communities (Skidmore et al., 2021). The NPP products for the Bavarian Forest National Park on a monthly basis are generated under Showcase. 4, pilot 4.3. myVARIABLE of the e-shape project, which commits to the biodiversity conservation requirements, inter alia, and assesses the status and trends of biodiversity. In this context, GEO BON, one of the flagships of GEO, is developing the framework of the Essential Biodiversity Variables (EBVs). The EBVs are a minimum set of complementary measurements that capture major dimensions of biodiversity change and are produced by integrating primary observations (from, e.g., in-situ monitoring or remote sensing) in space and time.
Provide the DOI number of associated publications. Click Plus to add DOIs.
https://doi.org/
10.1029/2010GB003942
https://doi.org/
10.3390/rs10091433
https://doi.org/
10.3390/rs13132522
https://doi.org/
10.1038/s41559-021-01451-x
The method of production of the original data.
Hover to see a suggestion for a minimum description.
To compute the net primary productivity (NPP), two parameters must be considered, namely, respiration of vegetation (Rd) and gross primary productivity (GPP). NPP = GPP - Rd Here, GPP is calculated using the light use efficiency (LUE) model. In this respect, potential light use efficiency (LUE), the fraction of absorbed photosynthetically active radiation (FAPAR), and photosynthetically active radiation (PAR) are required. In this regard, FAPAR is computed using Sentinel-2 data with a 20-meter resolution using SNAP software. PAR was obtained from the flux tower located close to Bavarian Forest National Park. GPP = PAR × FAPAR × PAR However, to calculate PAR, maximal light use efficiency (〖ε 〗_max) in the ecosystem, Tscalar, Wscalar and Pscalar which are the down-regulation scalars for the effects of temperature, water and leaf phenology on the PAR of vegetation type needs to be provided. In this regard, Wscalar and Pscalar were calculated using Earth observation data. εmax value is considered based on the literature from coniferous and deciduous forests. Tscalar is computed using temperature data (e.g., maximum, minimum, average, optimal) obtained from a flux tower near the Bavarian Forest National Park. LUE = εmax × Tscalar × Wscalar × Pscalar Rd is affected by air temperature and GPP. We adopted the empirical relationship developed by Goward and Dye, 1987. Further on, NPP computed from its empirical relationship between GPP and R_d. R_d = (((7.825 + 1.145T)⁄100)) × GPP Goward, S. N. and Dye, D. G., Evaluation north americal net primary productivity with satellite observations,Adv. Space Res., 7(7), 165-174, 1987 https://doi.org/10.1016/0273-1177(87)90308-5
The name of the Project.
The URL from the project website. https://e-shape.eu/
The name of the person or other creator type principally responsible for creating this data.
The email of the person or other creator type principally responsible for creating this data. e.neinavaz@utwente.nl
e.neinavaz@utwente.nl
The names of the co-creators responsible for creating this data. Click Plus to add co-creators.
Select between Creative Commons (CC) or Non-CC license.
Please select the CC license from the list. We recommend the use of CC BY 4.0

Essential Biodiversity Variables

Select the EBV class and the EBV name for the dataset. For cross-cutting use the comment at the bottom of the page for further information.
Genetic composition
Intraspecific genetic diversity
Genetic differentiation
Effective population size
Inbreeding
Other
Species populations
Species distributions
Species abundances
Other
Species traits
Morphology
Physiology
Phenology
Movement
Other
Community composition
Community abundance
Taxonomic and phylogenetic diversity
Trait diversity
Interaction diversity
Other
Ecosystem functioning
Primary productivity
Ecosystem phenology
Ecosystem disturbances
Other
Ecosystem structure
Live cover fraction
Ecosystem distribution
Ecosystem Vertical Profile
Other
Ecosystem services
Pollination
Other
Cross-cutting

Biological entity

Select the entity type of the dataset.
Species
Communities
Ecosystems
Other
None
A description of the range of taxa or ecosystem types addressed in the dataset. E.g. "300 species of mammals”, “Forests”, etc.
The reference as a URL. N/A

Metric

Provide the name, description, units of minimum 1 metric. Click Plus to add metrics.

Scenario

Spatial domain

Global
Continental/Regional
National
Sub-national/Local
Name of the continent/region/country/area, separated by comma
meter
southWest lat: 5412680, lon: 366020
northEast lat: 5443800, lon: 398540

Temporal domain

The targeted time period between each value in the dataset.
decadal
annually
monthly
weekly
daily
Other
Irregular
Single time
Select the temporal extent of the dataset.
When the dataset represents a Single time, then use the same start and end date.
__

Environmental domain *

Terrestrial
Marine
Freshwater
Miscellaneous information about the data, not captured elsewhere. E-shape is a unique initiative that brings together decades of public investment in Earth Observation and in cloud capabilities into services for the decision-makers, the citizens, the industry and the researchers. It allows Europe to position itself as global force in Earth observation by leveraging Copernicus, making use of existing European capacities, and improving user uptake of the data from GEO assets. In the e-shape initiative, 27 cloud-based pilot applications under the seven thematic areas address societal challenges, foster entrepreneurship, and support sustainable development, in alignment to the three main GEO priorities (e.g., SDGs, Paris Agreement, and Sendaï Framework). Link to the data: https://dikke.itc.utwente.nl:5001/sharing/SHkf0v82y