You are viewing Version 2, the most recent version of this dataset.
2 version(s) available
Date of publication: December 5, 2022
Version 2
Date of publication: December 5, 2022
Type of change: Metadata
Description: Update metric.
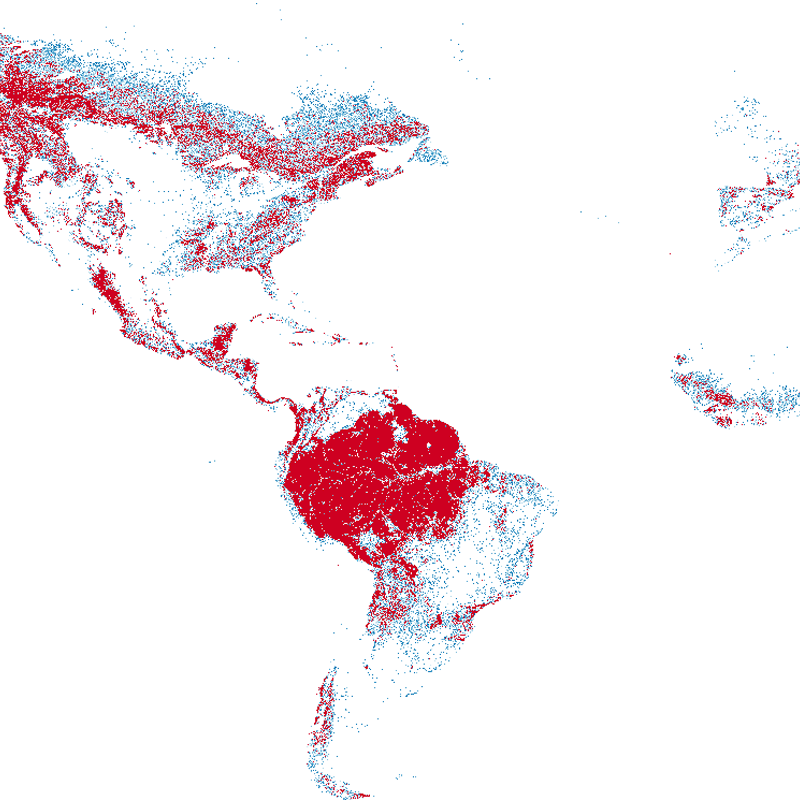
Relative Magnitude of Fragmentation (RMF)
by Babak NaimiWe use an existing spatially contiguous, global remote-sensing data product (i.e. the 27-year annual ESA CCI land cover maps which can be categorized as an EBV ‘Ecosystem Distribution’) to derive an annual (27 year) time-series of the Relative Magnitude of Fragmentation (RMF) at a global scale and with a spatial resolution of 300m. From this derived EBV data product, we can calculate a RMF indicator of ecosystem degradation, i.e. the change, ...(continue reading)
DOI 10.25829/gsgf87Citation
Naimi, B., Kissling, W. (2022). Relative Magnitude of Fragmentation (RMF) (Version 2) [Dataset]. German Centre for Integrative Biodiversity Research. https://doi.org/10.25829/gsgf87ESALand covergrid celltime-series
| Entities |
|---|
| Forest |
The EBV Data Portal is supported by