You are viewing Version 2, the most recent version of this dataset.
2 version(s) available
Date of publication: August 30, 2023
Version 2
Date of publication: August 30, 2023
Type of change: Data
Description: change data
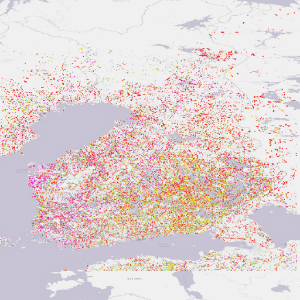
Forest cover loss for Finland (e-shape, 0.025 degrees)
by Miguel FernandezThis EBV dataset is based completely on the time series analysis produced by Hansen et al., (2013) in the version 1.8, which examines the global Landsat archive at a special resolution of 30 meters to characterize global forest extent and change from 2000 trough 2020. In this EBV dataset we focus on "Forest Cover loss" defined as a stand-replacement disturbance, or a change from a forest to non-forest state. The original data from Hansen et al., ...(continue reading)
DOI 10.25829/np5h42Citation
Fernandez, M. (2023). Forest cover loss for Finland (e-shape, 0.025 degrees) (Version 2) [Dataset]. German Centre for Integrative Biodiversity Research. https://doi.org/10.25829/np5h42FinlandForest lossForest change
| Entities |
|---|
| Forest |
The EBV Data Portal is supported by