You are viewing the Initial Version, the most recent version of this dataset.
1 version(s) available
Date of publication: April 4, 2022

Version 1

Date of publication: April 4, 2022

Type of change:

Description:

preview image

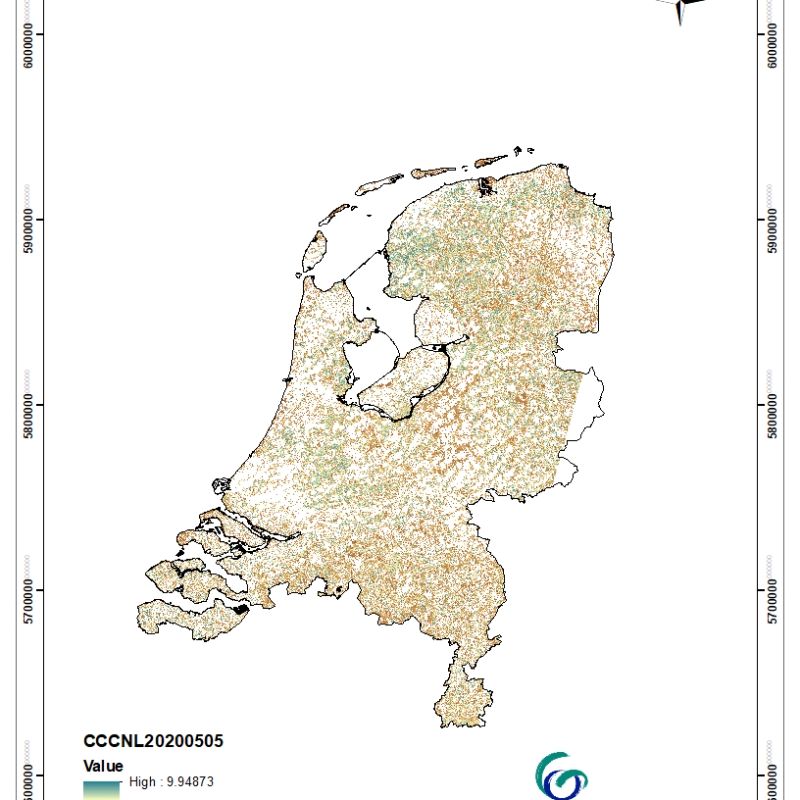
Canopy Chlorophyll Content for the Netherlands

by Elnaz Neinavaz

Canopy chlorophyll Content (CCC) is the total amount of chlorophyll a and b pigments in a contiguous group of plants per unit ground area often expressed in mg/m2 (Gitelson et al., 2005). It is a product of leaf chlorophyll content (i.e., the chlorophyll content of a fresh green leaf divided by its one-side area (µmg/cm2)) and the leaf area index. CCC is a terrestrial ecosystem functional EBV that describes the distribution of chlorophyll pig ...(continue reading)

Data: netCDF (5.18GB)
Metadata: ACDD (JSON) | EML (XML)

Canopy Chlorophyll ContentSentinel-2Netherlandse-shapeRemote Sensing-EBVs

The title of the dataset.
The date on which this version of the data was created in YYYY-MM-DD format.
A paragraph describing the dataset.
Hover to see a suggestion for a good description. Allowed:
Canopy chlorophyll Content (CCC) is the total amount of chlorophyll a and b pigments in a contiguous group of plants per unit ground area often expressed in mg/m2 (Gitelson et al., 2005). It is a product of leaf chlorophyll content (i.e., the chlorophyll content of a fresh green leaf divided by its one-side area (µmg/cm2)) and the leaf area index. CCC is a terrestrial ecosystem functional EBV that describes the distribution of chlorophyll pigments within the 3D canopy surface. Thus, This defines the total photosynthetically active radiation absorbed by the canopy (Gitelson et al., 2003; Ustin et al., 2009). The chlorophyll content is thought to be one of a constellation of co-evolved traits that vary together across species in relation to contrasting environmental conditions (Reich et al., 2003). Monitoring the dynamics of the CCC helps to understand the adaptation of forest, crop, and other plant canopies to such factors (Feret et al. 2017). As a result, the amount and spatial distribution of chlorophyll content is vital for measuring and understanding plant growth, ecosystem primary productivity and ecosystem dynamics. The canopy chlorophyll products for the Netherlands on monthly basis are generated under Showcase. 4, pilot 4.3. myVARIABLE of the e-shape project, which commits to the biodiversity conservation requirements, inter alia, and assess the status and trends of biodiversity. In this context, GEO BON, one of the flagships of GEO, is developing the framework of the Essential Biodiversity Variables (EBVs). The EBVs are a minimum set of complementary measurements that capture major dimensions of biodiversity change and are produced by integrating primary observations, (from e.g. in-situ monitoring or remote sensing), in space and time. Canopy chlorophyll content is considered as remote sensing biodiversity products by remote sensing and ecology communities. Féret, J, B., A.A. Gitelson, S.D. Noble, S. Jacquemoud PROSPECT-D: towards modeling leaf optical properties through a complete lifecycle Remote Sens. Environ., 193 (2017), pp. 204-215 Gitelson, A.A, Andrés Viña Verónica Ciganda Donald C. Rundquist Timothy J. Arkebauer (2005), Remote estimation of canopy chlorophyll content in crops. Geophysical Research Letters 32(8). https://doi.org/10.1029/2005GL022688 Gitelson, A. A., Vina, A., Arkebauer, T. J., Rundquist, D. C., Keydan, G., & Leavitt, B. (2003). Remote estimation of leaf area index and green leaf biomass in maize canopies. Geophysical Research Letters, 30(5), 52–54. Retrieved from http://www.sciencedirect.com/science/article/B6WPY-49H70PP-497/2/4cd9159e3f39a07a15c0f430abd8bbd4 Reich, P. B., Buschena, C., Tjoelker, M. G., Wrage, K., Knops, J., Tilman, D. & Machado, J. L. 2003. Variation in growth rate and ecophysiology among 34 grassland and savanna species under contrasting N supply: a test of functional group differences. New Phytologist, 157, 617-631. Ustin, S. L., Gitelson, A. A., Jacquemoud, S., Schaepman, M., Asner, G. P., Gamon, J. A., & Zarco-Tejada, P. (2009). Retrieval of foliar information about plant pigment systems from high-resolution spectroscopy. Remote Sensing of Environment, 113(Supplement 1), S67–S77. Retrieved from http://www.sciencedirect.com/science/article/B6V6V-4W7RJYR-1/2/58a4cb652674c7aea4caed7df189aacc.
Provide the DOI number of associated publications. Click Plus to add DOIs.

N/A

The method of production of the original data.
Hover to see a suggestion for a minimum description.
Sentinel-2A images with 10-meter resolution acquired in 2020 (from January to November) on the monthly basis, on a relatively cloud-free date(s), (< 10% cloud cover), and were used to predict the CCC for the Netherlands. For retrieval of the CCC, two simple ratio vegetation indices optimized for forests and non-forest vegetation were applied (Ali et al., 2020a; Ali et al., 2020b). Ali, A. M., Darvishzadeh, R., Skidmore, A., Heurich, M., Paganini, M., Heiden, U., & Mücher, S. (2020a). Evaluating prediction models for mapping canopy chlorophyll content across biomes. Remote Sensing, 12(11), 1788. Ali, A. M., Darvishzadeh, R., Skidmore, A., Gara, T. W., O’Connor, B., Roeoesli, C., ... & Paganini, M. (2020b). Comparing methods for mapping canopy chlorophyll content in a mixed mountain forest using Sentinel-2 data. International Journal of Applied Earth Observation and Geoinformation, 87, 102037. geotiff dataset download links: https://dikke.itc.utwente.nl:5001/sharing/XhROrVF8C, https://dikke.itc.utwente.nl:5001/sharing/dxpmUlfuo, https://dikke.itc.utwente.nl:5001/sharing/RdBnKbdFD, https://dikke.itc.utwente.nl:5001/sharing/FMalUW5qF, https://dikke.itc.utwente.nl:5001/sharing/RvrQrrhVg, https://dikke.itc.utwente.nl:5001/sharing/EBG9k7cb1, https://dikke.itc.utwente.nl:5001/sharing/77pz5Puc5, https://dikke.itc.utwente.nl:5001/sharing/z2wGyLyns, https://dikke.itc.utwente.nl:5001/sharing/mkNTzdjL2, https://dikke.itc.utwente.nl:5001/sharing/KxinWzVUi, https://dikke.itc.utwente.nl:5001/sharing/iH6z73q8K, https://dikke.itc.utwente.nl:5001/sharing/9TqcI5l5T
The coverage content type describes the general content type of the resource (multiple selection possible).
The name of the Project.
The URL from the project website. https://e-shape.eu/
The name of the person or other creator type principally responsible for creating this data.
The email of the person or other creator type principally responsible for creating this data. e.neinavaz@utwente.nl
e.neinavaz@utwente.nl
The names of the co-creators responsible for creating this data. Click Plus to add co-creators.
Select between Creative Commons (CC) or Non-CC license.
Please select the CC license from the list. We recommend the use of CC BY 4.0

Essential Biodiversity Variables

Select the EBV class and the EBV name for the dataset. For cross-cutting use the comment at the bottom of the page for further information.
Genetic composition
Intraspecific genetic diversity
Genetic differentiation
Effective population size
Inbreeding
Other
Species populations
Species distributions
Species abundances
Other
Species traits
Morphology
Physiology
Phenology
Movement
Other
Community composition
Community abundance
Taxonomic and phylogenetic diversity
Trait diversity
Interaction diversity
Other
Ecosystem functioning
Primary productivity
Ecosystem phenology
Ecosystem disturbances
Other
Ecosystem structure
Live cover fraction
Ecosystem distribution
Ecosystem Vertical Profile
Other
Ecosystem services
Pollination
Other
Cross-cutting

Biological entity

Select the entity type of the dataset.
Species
Communities
Ecosystems
Other
None
A description of the range of taxa or ecosystem types addressed in the dataset. E.g. "300 species of mammals”, “Forests”, etc.
The reference as a URL. N/A

Metric

Provide the name, description, units of minimum 1 metric. Click Plus to add metrics.

Scenario

Spatial domain

Global
Continental/Regional
National
Sub-national/Local
Name of the continent/region/country/area, separated by comma
southWest lat: 5622120, lon: 523740
northEast lat: 5942330, lon: 798180

Temporal domain

The targeted time period between each value in the dataset.
decadal
annually
monthly
weekly
daily
Other
Irregular
Single time
Select the temporal extent of the dataset.
When the dataset represents a Single time, then use the same start and end date.
-

Environmental domain *

Terrestrial
Marine
Freshwater
Miscellaneous information about the data, not captured elsewhere. E-shape is a unique initiative that brings together decades of public investment in Earth Observation and in cloud capabilities into services for the decision-makers, the citizens, the industry and the researchers. It allows Europe to position itself as global force in Earth observation by leveraging Copernicus, making use of existing European capacities and improving user uptake of the data from GEO assets. In the e-shape initiative, 27 cloud-based pilot applications under the seven thematic areas address societal challenges, foster entrepreneurship and support sustainable development, in alignment to the three main GEO priorities (e.g., SDGs, Paris Agreement and Sendaï Framework).