You are viewing Version 2, the most recent version of this dataset.
2 version(s) available
Date of publication: July 18, 2023
Version 2
Date of publication: July 18, 2023
Type of change: Metadata
Description: Update metrics
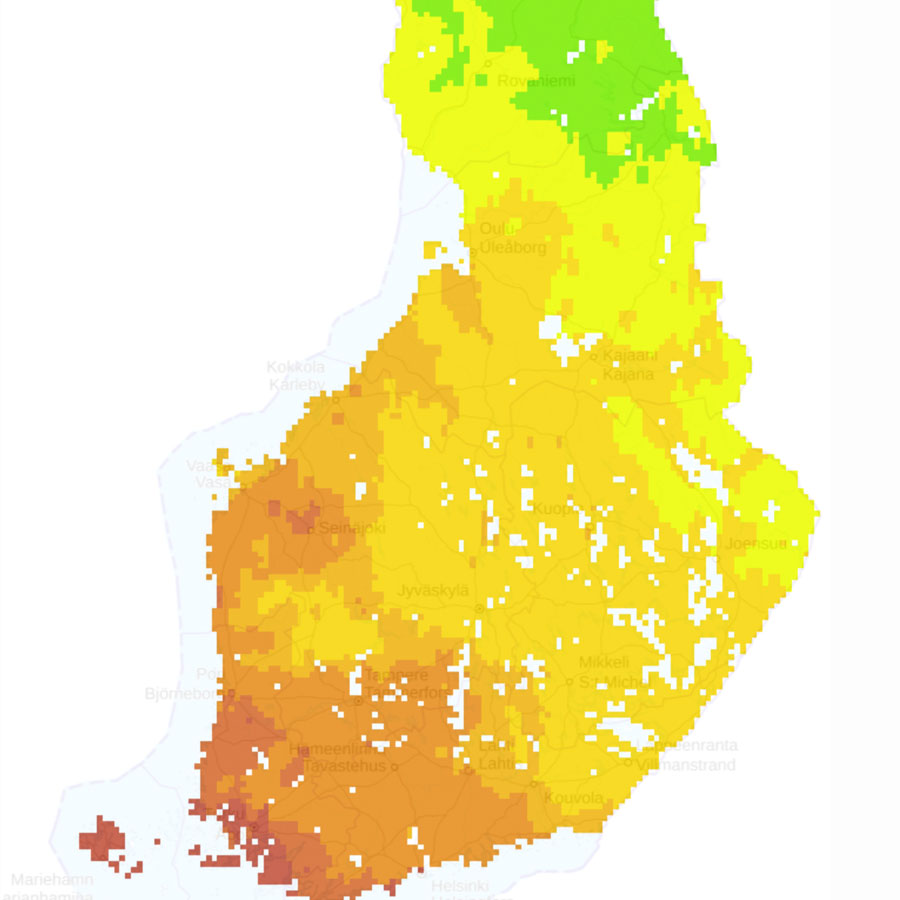
Vegetation Phenology in Finland
by Kristin BöttcherDatasets present the yearly maps of the start of vegetation active period (VAP) in coniferous forests and deciduous vegetation during 2001-2018 in Finland. The start of the vegetation active period is defined as the day when coniferous trees start to photosynthesize and for deciduous vegetation as the day when trees unfold new leaves in spring. The datasets were derived from satellite observations of the Moderate Resolution Imaging Spectroradiome ...(continue reading)
DOI 10.25829/xf8ek6Citation
Böttcher, K. (2023). Vegetation Phenology in Finland (Version 2) [Dataset]. German Centre for Integrative Biodiversity Research. https://doi.org/10.25829/xf8ek6BorealGreen-upPhenologyVegetationStart of season
| Entities |
|---|
| Coniferous |
| Deciduous |
The EBV Data Portal is supported by